Mutual funds, for people who think in decades
You already know what a mutual fund is: a SEBI-regulated pool that invests in equity, debt or money-market instruments by a stated objective. This page is about what the familiar SIP table will not tell you at first glance. No schemes, no rankings, no pitches: just the mathematics most investors never sit with.
₹10,000 every month, instalments at the start of each month, growth compounded monthly at the assumed rate. Illustrative arithmetic, not a forecast of any product. The question this table answers is not "which rate": it is who is doing the work: you, or compounding.
| You invest | Over | at 8% | at 10% | at 12% | Compounding's share* |
|---|---|---|---|---|---|
| ₹6 L | 5 yrs | ₹7.40 L | ₹7.81 L | ₹8.25 L | 27% |
| ₹12 L | 10 yrs | ₹18.42 L | ₹20.66 L | ₹23.23 L | 48% |
| ₹18 L | 15 yrs | ₹34.83 L | ₹41.79 L | ₹50.46 L | 64% |
| ₹24 L | 20 yrs | ₹59.29 L | ₹76.57 L | ₹99.91 L | 76% |
| ₹30 L | 25 yrs | ₹95.74 L | ₹1.34 Cr | ₹1.90 Cr | 84% |
| ₹36 L | 30 yrs | ₹1.50 Cr | ₹2.28 Cr | ₹3.53 Cr | 90% |
*Of the value at 12%, the part contributed by growth rather than by your own instalments. Verify any cell yourself in our SIP calculator: same convention, same numbers.
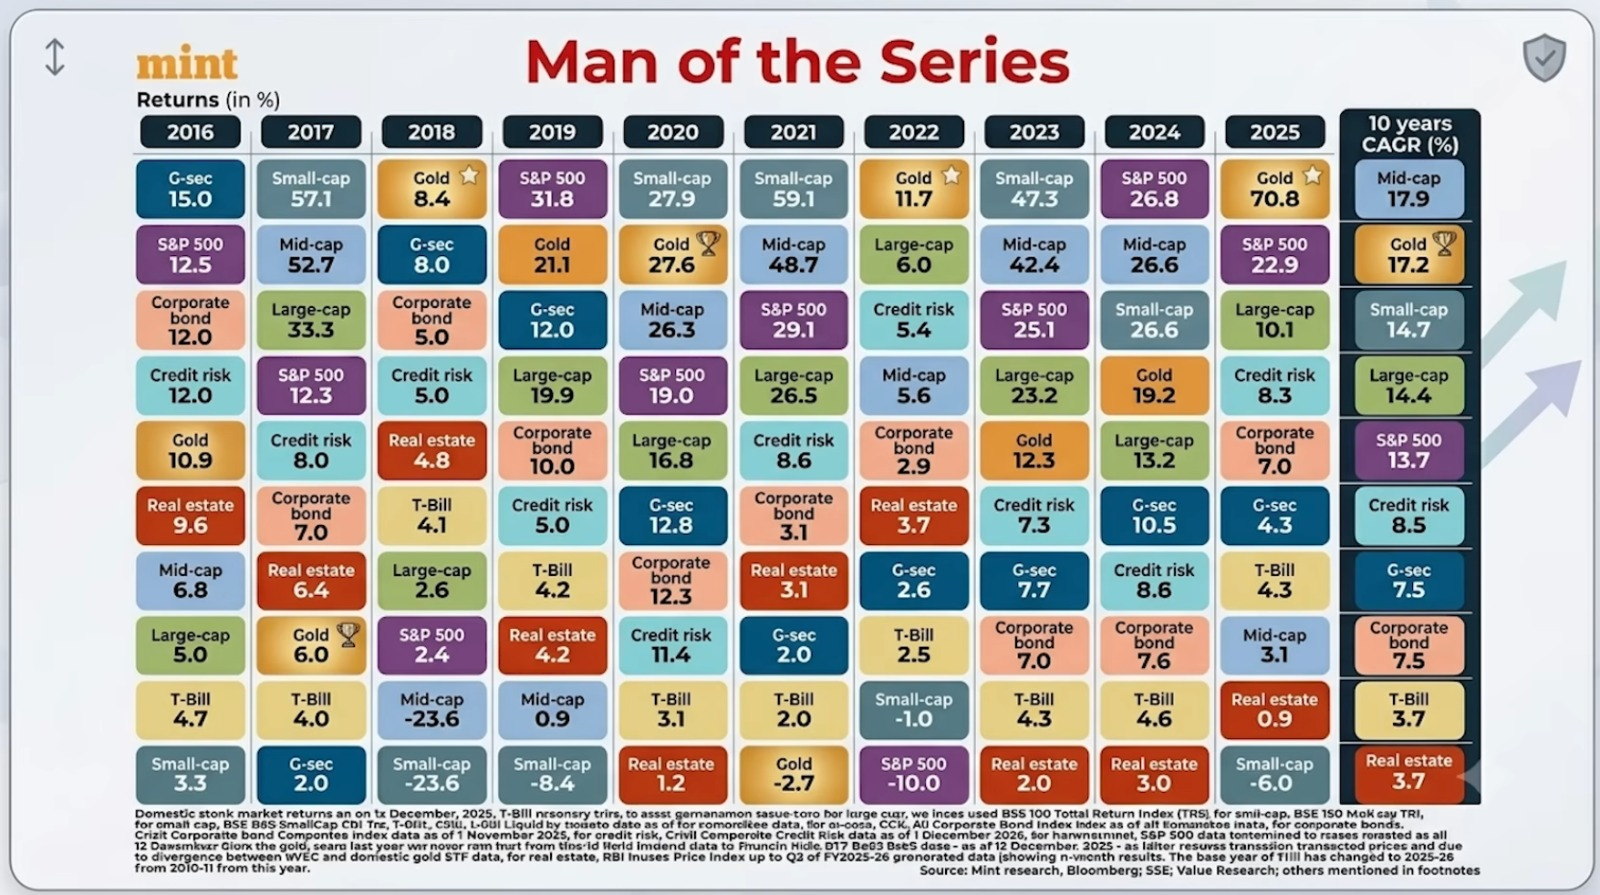
Also see: one decade of asset-class leadership, year by year →
The same six journeys, drawn to true scale against the 30-year outcome at 12%. Navy is your money; gold is compounding's. Watch what time does to both the size of the room and its colour.
What the table hides in plain sight
Three readings of the same 12% column that separate investors who compound from investors who merely invest.
The last doubling pays for all the others
At 12%, the 30-year journey ends at ₹3.53 crore, but it stood at only ₹1.67 crore at year 24. The final six years add ₹1.86 crore: more than everything built in the first twenty-four. Compounding is back-loaded by nature, which is precisely why abandoning it late is the costliest exit of all.
The first fifteen years decide 78%
Freeze the SIP at year 15 and let that ₹50.46 lakh simply stay invested: it alone grows to ₹2.76 crore by year 30, or 78% of the full outcome. The second fifteen years of instalments, another ₹18 lakh out of pocket, contribute the remaining 22%. Early money is senior money. Start beats size.
A behaviour you control beats a rate you chase
A flat ₹10,000 SIP at an aggressive 14% assumption reaches ₹1.32 crore in twenty years. The same SIP at a sober 12%, but stepped up 10% each year as income grows, reaches ₹1.99 crore. The step-up is a decision you control every year; the extra two percent is a hope. Discipline out-earns ambition.
Every rupee of gold in the chart above was earned by an investor who stayed: through the years that felt pointless and the falls that felt terminal. That staying is not a personality trait; it is a practice. A plan made calmly, reviewed on schedule, and held to when markets test it. That practice is our profession.
See how we keep investors investedWhat a mutual fund is not
Not a deposit, and never a guaranteed or assured outcome: unit values move with the markets a scheme invests in, past performance does not indicate future results, and every scheme charges an expense ratio deducted before the value you see. The assumed rates above are illustrations of arithmetic, not of any product.
Read before you decide
The Scheme Information Document, Key Information Memorandum and factsheets state each scheme's objective, riskometer level, costs and lock-ins in plain terms. They exist for investors, not regulators. Read them carefully, and consult your own professional adviser before making any investment decision.
Mr. Nikesh, partner of the LLP, is separately registered with AMFI as a Mutual Fund Distributor under ARN 182576. Mutual fund transactions, if any, are undertaken by him in his individual capacity and not by the LLP. The LLP does not hold itself out as an AMFI-registered Mutual Fund Distributor.
The information provided in this section is for general education and awareness purposes only. It should not be construed as investment advice, mutual fund distribution, solicitation, recommendation, or an offer to buy or sell any mutual fund scheme. All figures are computed at stated assumed rates for illustration; they are not projections and no rate of return is assured. Investors should read all scheme-related documents carefully and consult their own professional adviser before making any investment decision.